Likelihood function
The likelihood function measures how likely it to observe an output for a give set of parameters to a model. Mathematically it is represented through the conditional probability.
where,
-
PDF
-
an output
-
an input
-
model parameter. Example: In a linear regression model relating and
Here, are the parameters of the model. is the intercept, and is the slope.
- precision, is the inverse of the variance ().
Note: High precision means low variance and vice versa.
Assumption
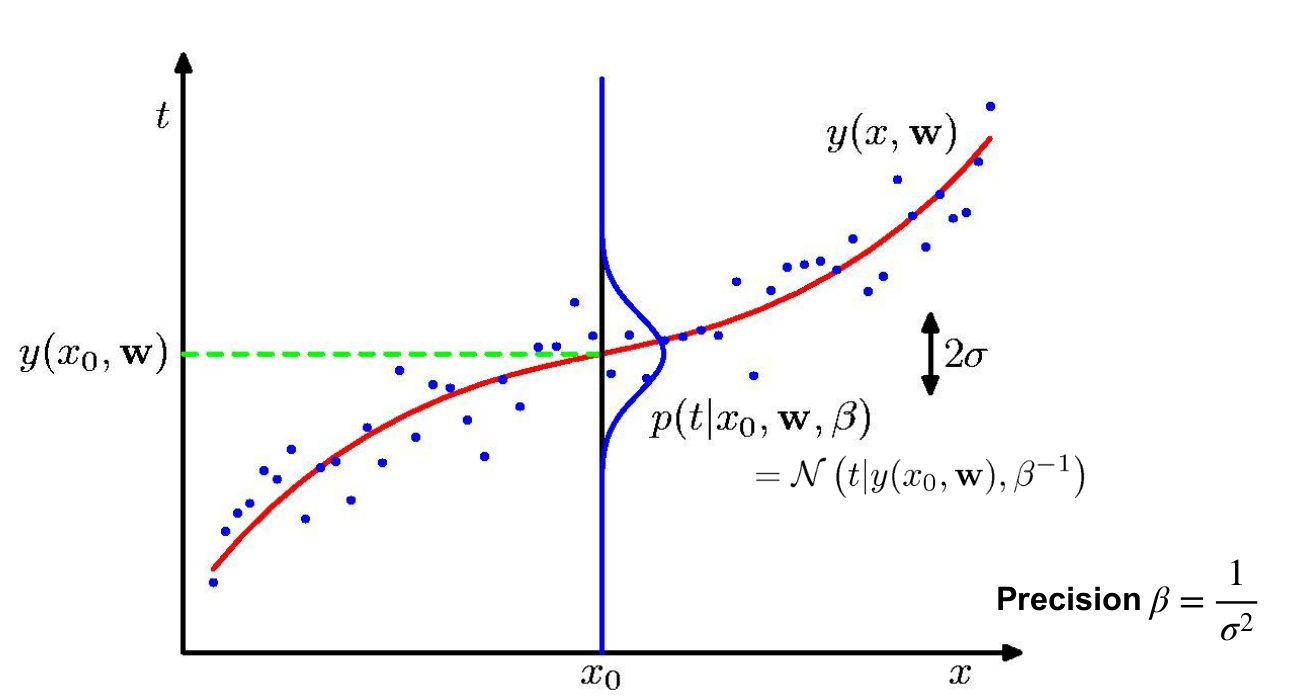
The probability is assumed to be Gaussian distributed with mean on the model and variance (for the 1-dimensional case)1
where,
- is the regression model used.
Measurement to Stochastic Model
For a given parametric model and target . The noise can be modeled by the Gaussian Distribution .
The Mean is because we center the Gaussian around the predicted value.
Since we have a distribution (Probabilistic), the equality is removed.
Finally we get
Applying this to the whole Data-set
We define the Likelihood function (Data-Likelihood) and express it as a joint density function where the stochasticity at each target value is expressed through the Gaussian.
Note:
- We assume the data points to be independent. Inductive bias!
- The Joint Density of a Independent values is the product of the densities of individual data.
Parameter Optimisation
Involves maximising the Likelihood for the given parameters i.e. we maximise the probability of observing the measured output () for a given model parameter () and input ()
Note: the actual value of at the maximum is not important!
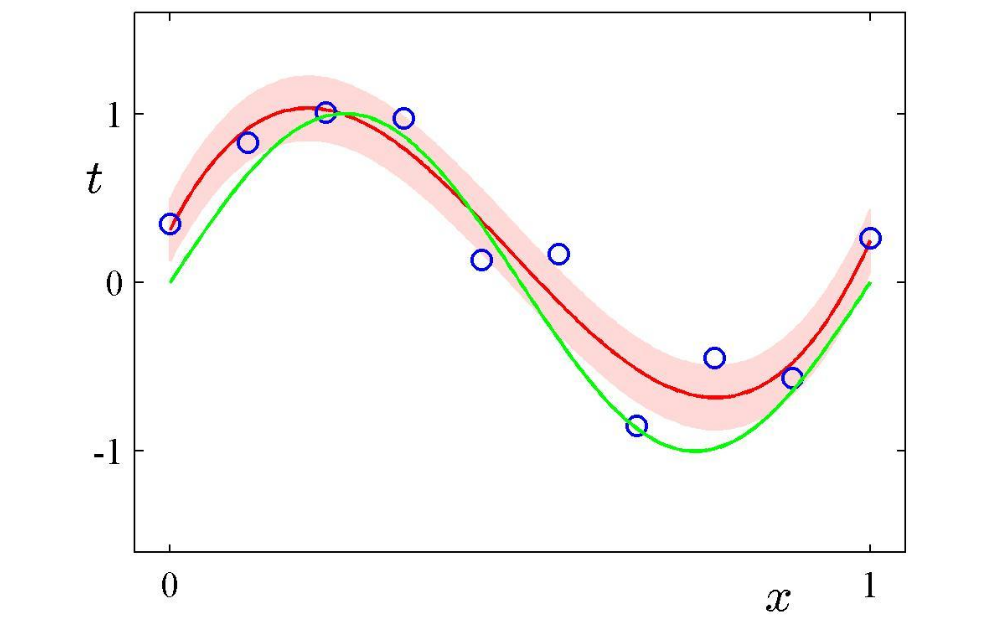
Generalisation
Select parameters & which maximize the likelihood and represent the optimal output distribution as a Gaussian:
Finding parameters from the probabilistic approach
-
Start with the stochastic data model:
where
-
Construct the likelihood function for a single data point:
-
Form the data likelihood by assuming independence of data points:
-
Take the negative logarithm to get the error function:
-
Minimize by setting its derivative to zero:
-
For linear models , this gives:
-
The optimal precision parameter is:
Footnotes
-
Pattern Recognition Bishop Pg. 29 ↩