Are a representation of the probability of variables and their conditional dependencies through a graphical network.
Where,
- Node: Variable and it’s associated Probability distribution.
- Parent Node: Prior.
- Child Node: Conditional Dependency.
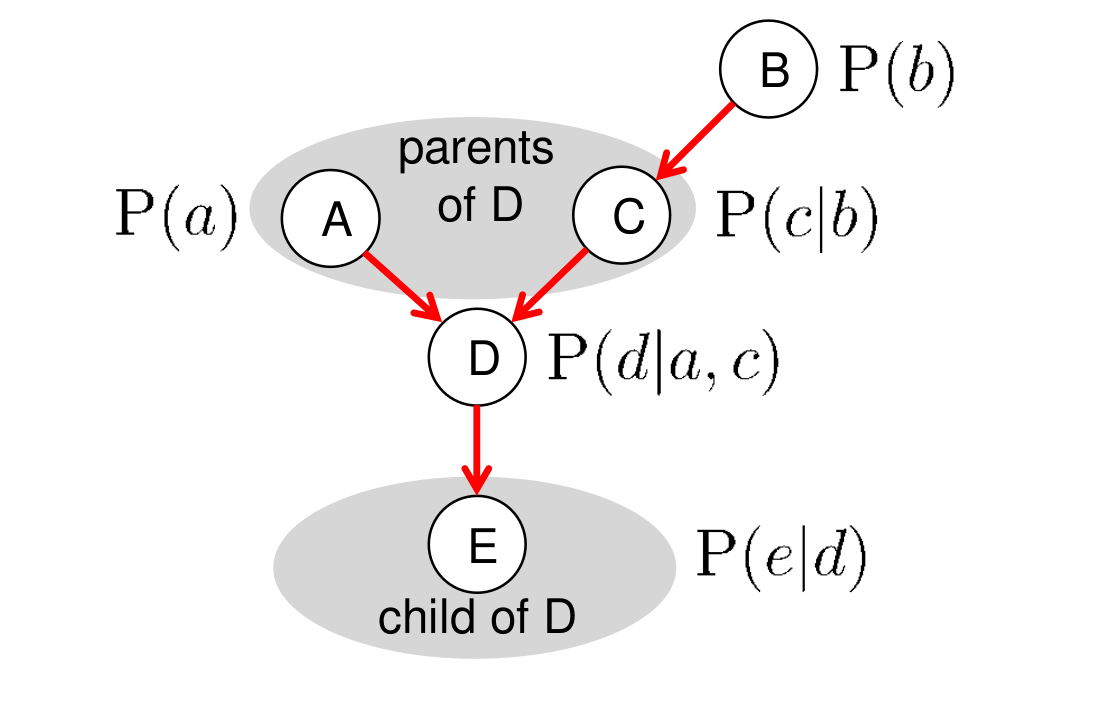
- Node A:
- Node B:
- Node C:
- Node D:
- Node E:
Applications
- Medical Diagnosis: It can be used to model relationships between symptoms, diseases and risk factors.
graph TD
     Diseases
    D1[Heart Disease]
    D2[Diabetes]
    D3[Hypertension]

     Patient Characteristics to Diseases
    C1 --> D1 & D2 & D3
    C2 --> D1 & D2 & D3
    C3 --> D1 & D2 & D3

     Styling
    classDef characteristics fill:stroke-width:2px;
    classDef diseases fill:stroke-width:2px;
    classDef symptoms fill:stroke-width:2px;

    class C1,C2,C3 characteristics;
    class D1,D2,D3 diseases;
    class S1,S2,S3,S4 symptoms;

    %% Title
    title[Medical Diagnosis Bayesian Network]
    style title fill:none,stroke:none